It is
difficult to produce unusual report layouts automatically with functionalities
provided by reporting tools. But if we can prepare data sources in an
appropriate way, the difficulty of building such a report will be significantly
decreased.
esProc
supports set operations, order-related calculations, dynamic script execution, and
provides a simple and easy-to-use JDBC interface. So it is ideal to use esProc
as the tool for preparing the data required by the report. The reporting tool
executes an esProc script as it executes a database stored procedure, passes
parameters to the script and gets the returned esProc result through JDBC. See How to Use esProc to Assist Reporting
Tools for details.
Below
are examples of some unusual layouts and the ways of handling them in esProc.
Horizontal multi-column layout
Most of the reporting tools support vertical
multi-column layout, but few can handle horizontal multi-column layout. Yet
this shortcoming can be remedied by using esProc to prepare the data set in
advance:
Below is
a selection of the database table emp
that has three fields:
|
EId
|
Name
|
Dept
|
|
4
|
Emily
|
HR
|
|
5
|
Ashley
|
R&D
|
|
6
|
Matthew
|
Sales
|
|
7
|
Alexis
|
Sales
|
|
8
|
Megan
|
Marketing
|
|
9
|
Victoria
|
HR
|
|
10
|
Ryan
|
R&D
|
|
11
|
Jacob
|
Sales
|
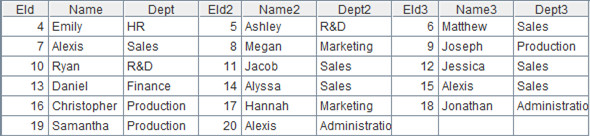
The
desired layout is that data is sequentially presented in a horizontal way in 3
columns, as shown below:

By transforming the original 3-column table to a 9-colulmn table with esProc, you can create a horizontal multi-column layout with the reporting tool:
Divide rows into three parts by their
sequence numbers and store them respectively in A2, B2 and C2. And then
concatenate the fields in B2 and C2 with those in A2:
Interlocking multi-column layout
Arrange the records of the database table emp horizontally in two columns. The record in the second column of the report’s each row will always be the first record in the next row’s first column, as shown below:

esProc script:

A2: An interlocking concatenation, which, in sequence, strings the current record and the previous one together. Get the concatenation result beginning from the third row. The result is like this:

Present
the records horizontally in two columns, as the preceding case shows.
Dynamic vertical multi-column layout based on
single-field data sets
|
sOrder
26
33
84
133
32
39
43
71
99
20
83
97
107
135
142
1
|
esProc script:

A1: Retrieve data from the single-field table and convert it to a sequence (an ordered set).
A2: Create a two-dimensional table with the same structure as the expected report, with the initial values being nulls. Row and Col are report parameters.

A3: This is the final result by appending data to A2:

Printing a wide table horizontally
The
database table sOrderEmp is too wide
to fit across one piece of paper. The report requires that each page be printed
with column headings and column numbers and that the columns from the first to
the Nth be printed on one page and those from the (N+1)th
to the (2N)th be printed on the next page, and so forth. This is
shown as follows:

esProc script:

This standard
code can be used to print any database argSource
in argPagCol columns and argPageRow rows on each page. A2: Dynamically
generate an empty two-dimensional table with argPageCol columns. A3: Group A1 every argPageRow rows. A4: Group A1’s field names every argPageCol ones. A5: Concatenate strings
together to be processed dynamically by A6. A6: Loop through each group of rows
in A3 and insert argPageCol*argPageRow
records to A2 each time, with field names and values for each page being
appended sequentially. A7: Return A2 to the reporting tool.

Rows duplication
Get three duplicates of the original
records and present them in a report.

A2: [] indicates a sequence (an order set). [~] represents a single-member sequence containing the current record from A1. [~]*3 makes 3 duplicates of the current record. The conj function performs the duplication of every record of A1 and then the concatenation. This is the result:

Condition-controlled formats for grouped reports
Build a grouped report whose data comes
from the database table sOrder, in
which Seller is the grouping field, and Client and Amount hold the detail data.
Here are the requirements:
1.In each group of detail data,
the rows from the second down to the end will display “+”, but the first row
will not display it.
2.If there is more than one row
in each group of detail data, display a subtotal of the amounts at the end. No
subtotal for a single-row group.

esProc code:

Explanation: Query the database, group data by SellerId and loop through every group to append data values in the current group to the empty A2. Put “+” before the Client value if the sequence number “#” is greater than 1; append a subtotal row to A2 if there is more than one row in the current group. Below is the final result of A2:

Return A2 to the reporting tool via JDBC.
Inserting a sub-table dynamically into the main table
The database table dColThread is the main table, with tID being the primary key; dColQuestion is the sub-table, whose
foreign key is tID. They are shown as follows:
dColThread
|
tID
|
ApplicationName
|
User
|
Phone
|
Decline
|
|
A01
|
mfc
|
Bill
|
+70000000
|
1
|
|
A02
|
mfc
|
John
|
+18761221
|
2
|
|
A03
|
java
|
Jack
|
+8014001231
|
6
|
|
A04
|
mfc
|
Tim
|
+008613133123
|
4
|
|
A05
|
db
|
John
|
+18761221
|
8
|
dColQuestion
|
qID
|
tID
|
status
|
|
1
|
A01
|
yes
|
|
2
|
A01
|
no
|
|
3
|
A01
|
yes
|
|
4
|
A02
|
yes
|
|
5
|
A03
|
no
|
|
6
|
A04
|
no
|
|
7
|
A04
|
no
|
|
8
|
A05
|
yes
|
The report needs to query the main table by
ApplicationName and display the data in a list table. Each record of the main
table corresponds to multiple status values but less than 5 ones. They need to
be inserted horizontally between Phone and Decline fields of the main table,
with field names being QuestionNo1, QuestionNo2…QuestionNo5. If all values in a
column are nulls, the column won’t be shown.

esProc script:

Explanation: Retrieve the associated data from the main table and the sub-table using a SQL statement and group it by tID and loop through each group. Each loop will insert a record to the empty table sequence A3, during which fields of the main table will be inserted directly and the field of the sub-table will need to be converted into rows before the insertion, with the five fields being all supplied. Here’s the result of A3 after the loops:

Joining list tables horizontally
table 1 is a Oracle
database table and table2.xlsx is a
file. Both have the same structure. Below are selections of them:

We need
to group table1 and table2 respectively by name, get the number of records in
each group and calculate the sum of active field, and then present the results side
by side. Below is the desired layout:
|
name
|
count1
|
amount1
|
count2
|
amount2
|
|
dd
|
3
|
352
|
2
|
224
|
|
yy
|
1
|
32
|
||
|
zz
|
1
|
5
|
1
|
4
|
esProc script:

Explanation: Retrieve data from the database and the Excel file, and do a full join between them to put the fields we want in one data set. A5 stores the joining result, as shown below:

Inter-column calculation for the cross table
The database table store holds the sales amount of multiple products in 2014 and 2015.
You need to present the annual sales amount of every product in a cross table
and calculate the annual growth rate of every product. Below is a selection of
the source data:
|
Year item quantity
2014 Book 35
2015 Pencil 50
2014 Pencil 56
2015 Book 67
|
Below is the desired layout:

esProc script:

Explanation:
Columns of the cross table are generated dynamically. The inter-column
calculation needs a dynamic second reference. To do it, it’s difficult to write
a script with the reporting tool. Yet we can first use esProc to perform the
inter-column calculations and append the results to the source data, and then
we just need to take care of the design of the simple cross table.
