esProc provides standard JDBC interface to
be integrated easily with the reporting tool. This article will explain respectively
the integration of esProc and JasperReport in development environment and the deployment
in WEB server-side.
1. Integration in development environment
Access esProc JDBC to call the esProc
script using JasperReport iReport Designer through the following steps:
1.1. Create configuration files
Create the two configuration files –
config.xml and dfxConfig.xml – necessary for esProc JDBC.
1.1.1. config.xml
<?xml version="1.0"
encoding="UTF-8"?>
<Config Version="1">
<!-- Registration
code -->
<regCode>HOjw6-9da4x-NXkD6-089IX@w</regCode>
<charSet>ISO-8859-1</charSet>
<!-- Configure dfx
file’s searching path, which is an absolute path. There can be multiple paths
separated by semicolon(s). The dfx file can also be placed in the application’s
classpath which has the priority over a searching path for loading the file
-->
<dfxPathList>
<dfxPath>D:/dfx</dfxPath>
</dfxPathList>
<dateFormat>yyyy-MM-dd</dateFormat>
<timeFormat>HH:mm:ss</timeFormat>
<dateTimeFormat>yyyy-MM-dd
HH:mm:ss</dateTimeFormat>
<!-- Method one
for datasource configuration: configure connection pool in the application
server and specify the datasource name -->
<DBList>
<!-- Datasource
name must be consistent with that in the dfx file. Here MySQL database is used
-->
<DB name="mysql">
<property name="url"
value="jdbc:mysql://127.0.0.1:3306/test"/>
<property name="driver"
value="com.mysql.jdbc.Driver"/>
<property name="type" value="MYSQL"/>
<property name="user" value="root"/>
<property name="password" value=""/>
<property name="batchSize" value="1000"/>
<property name="autoConnect" value="false"/>
<property name="useSchema" value="false"/>
<property name="addTilde" value="false"/>
</DB></DBList>
<mainPath/>
<tempPath>temp</tempPath>
<bufSize>65536</bufSize>
<localHost/>
<localPort>0</localPort>
<logLevel>DEBUG</logLevel>
<callxParallel>1</callxParallel>
<nodeParallel>1</nodeParallel>
</Config>
1.1.2. dfxConfig.xml
<?xml version="1.0"
encoding="GBK"?>
<dfxConfig>
<maxConcurrents>10</maxConcurrents>
<maxWaits>10</maxWaits>
<log></log>
</dfxConfig>
1.1.3.JAR Load driver jars
esProc JDBC driver includes five jars - dm.jar, poi-3.7-20101029.jar, log4j_128.jar, icu4j_3_4_5.jar and dom4j-1.6.1.jar. They can be found in
esProc IDE’s [installation directory]\esProc\lib directory. If esProc also uses
other databases as the datasources, then the driver jars of these databases
need to be added too. For instance, mysql-connector-java-5.1.5-bin.jar
has been added here. Place all these jars in the classpath’s root path.
Except for these jars, the directory
(such as D:\lib\config) of the two configuration files – config.xml and
dfxConfig.xml – created in the first step needs to be placed in the classpath’s
root path too. Or compress the configuration files into the root directory of
any of the jars above, with their names remaining strictly the same.
Configure the classpath on the Tool Option
bar, as shown in the following figure:
1.2 Create a
datasource
Create a new datasource – esproc – on the
datasource configuration window. Select the JDBC driver com.esproc.jdbc.InternalDriver and enter the JDBC URL as jdbc:esproc:local://. Leave the
username and password blank.
esProc JDBC is a fully embedded computing
engine. All computations are performed in its embedded package, thus the URL is
local. On the other hand, since it isn’t a complete database, it has neither
the username nor the password.
After filling all necessary information,
click on “Test” to see whether the connection to the datasource has been
successfully established.
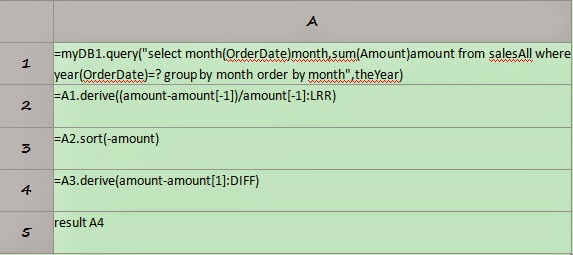
1.3 Deploy esProc script
Copy the esProc script (dfx) to dfxPath
configured in config.xml (such as D:/dfx configured in the above). Here we’ll
take the query of the closing stock price in a certain month as an example. The
esProc script is as follows:
1.4 Call esProc script in IDE
Create
a report and set the query
Create a new report – esProcReport, write
the query statement and call the esProc script using call dfxName(), in which
dfx name is stocks.
Select all the fields and execute the code
by clicking on Next Step to the end.
Because the esProc script needs to receive the
parameter representing the year and the month, it is necessary to set the
parameter for use in the query for the report after it is created. In the following
figure, add the parameter representing the year and the month and edit the
query for the report.
Then drag the parameter to the specified
position of the query statement, thus the query becomes as follows:
Edit
the report
Drag all fields under Fields to the report’s detail band and complete the edition, as
shown below:
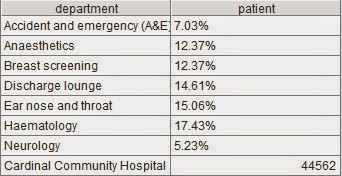
Preview
the report
Click on Preview and enter the parameter to
see the query result:
This is the
integration of esProc script and JasperReport in the development environment.
Next we’ll move on to explain how to deploy them in the web server-side.
2. Deploy web server-side
Select a suitable application server. For
this purpose, Tomcat6.0 is used here for illustration.
2.1 create a web application
Create a J2EE application, which is named,
say, JasperReport, and copy it to Tomcat’s webapps directory.
2.2 Create configuration files
Two configuration files – config.xml and
dfxConfig.xml – are needed. The configuration information is the same as that
for integration in development environment.
2.3 Deploy necessary jars
JasperReport’s
driver jar
Deploy jars necessary
for JasperReport into the application’s WEB-INF\lib directory. The JasperReport
jar can be found in ireport\modules\ext directory of iReport Designer’s
installation directory.
esProc
JDBC’s driver jar
Copy the jars - dm.jar, poi-3.7-20101029.jar, log4j_128.jar, icu4j_3_4_5.jar and dom4j-1.6.1.jar
- used in the above integration in the development environment and MYSQL’s
driver jar - mysql-connector-java-5.1.5-bin.jar
– to the application’s WEB-INF\lib
directory. Then copy config.xml and dfxConfig.xml to the application’s
WEB-INF\classes directory.
2.4 Copy the report
Copy the completed report (whose file
extension is .jasper) to the corresponding directory of the application. For
example, copy esProcReport.jasper to the application’s reportFiles directory.
2.5 Define and Publish the JSP
report
The following code is to define and publish
the JSP report, such as showReport.jsp:
<%@ page language="java"
contentType="text/html; charset=UTF-8"
pageEncoding="UTF-8"%>
<%@ page
import="java.io.*,
net.sf.jasperreports.engine.*,
net.sf.jasperreports.engine.util.*,
java.util.*,java.sql.*,
net.sf.jasperreports.engine.export.*"%>
<!DOCTYPE html PUBLIC "-//W3C//DTD
HTML 4.01 Transitional//EN" "http://www.w3.org/TR/html4/loose.dtd">
<html>
<head>
<meta http-equiv="Content-Type"
content="text/html; charset=UTF-8">
<title>Show JasperReport</title>
</head>
<body>
<%
String
report = request.getParameter("report");
File
reportFile = new
File(application.getRealPath("reportFiles/"
+
report));
//Load report object
JasperReport
jasperReport = (JasperReport) JRLoader
.loadObject(reportFile.getPath());
//Pass report parameter through Map
Map
parameters = new
HashMap();
//Assign value to parameter p1 of the report
parameters.put("p1", 200901);
//Connect to esProc
Class.forName("com.esproc.jdbc.InternalDriver");
Connection
conn = DriverManager.getConnection(
"jdbc:esproc:local://",
"",
"");
//Export the report to the page
JasperPrint
jasperPrint = JasperFillManager.fillReport(
jasperReport,
parameters, conn);
JRHtmlExporter
exporter = new
JRHtmlExporter();
exporter.setParameter(JRExporterParameter.JASPER_PRINT,
jasperPrint);
exporter.setParameter(JRExporterParameter.OUTPUT_WRITER,
out);
exporter.setParameter(
JRHtmlExporterParameter.IS_USING_IMAGES_TO_ALIGN,
Boolean.FALSE);
exporter.exportReport();
out.flush();
conn.close();
%>
</body>
</html>
2.6 Preview the report
Launch Tomcat and access the website http://127.0.0.1:8080/JasperReport/reportJsp/showReport.jsp?report=esProcReport.jasper
to preview the report as shown below, which means the deployment is completed.